
On November 5, 2026, the Minister of Finance and National Revenue, the Honourable François-Philippe Champagne,…

The Family Enterprise Economic Update
October decision brief
The economy is adapting. The trade relationship is not stabilizing.
Canada enters October with a more complicated picture than it carried into September. The second quarter produced a meaningful rebound in output and productivity, businesses are visibly redirecting some trade beyond the United States, and the federal government has proposed a much more generous investment deduction. At the same time, July GDP stalled, August employment fell, Canadian counter-tariffs took effect on September 8, and the United States escalated selected Section 338 measures from high tariffs to targeted import exclusions effective September 29. [1][2][3][5][6][17][19][20][21]
For a family with a family-owned enterprise, the implication is not to choose between optimism and pessimism. The relevant question is whether the enterprise has enough liquidity, pricing power, supplier flexibility and investment capacity to continue making good decisions while the rules change. The September data show that adaptation is occurring. They do not show that the risk has passed.
Our October assessment is therefore cautiously constructive on productive investment and market diversification, while defensive on customer concentration, tariff-sensitive inputs and working-capital exposure. Canada is not presently showing the broad contraction that was feared at the beginning of the trade dispute, but the statistics available at September 30 largely predate the September 8 escalation. The next two months of trade, employment, GDP and business-investment data will matter disproportionately.
Five numbers that matter this month
| Indicator | October reading | Family-enterprise interpretation |
| Canadian real GDP | Q2 +0.8% q/q; July 0.0% | A strong rebound followed by a flat start to Q3. |
| Canadian unemployment | 6.4% in August | Labour slack remains material. |
| Canadian CPI | 3.0% y/y in August | Inflation remains above 2%; tariff pass-through is a risk. |
| Business productivity | +1.0% q/q in Q2 | Encouraging, but not yet a structural trend. |
| Proposed Canada METR | 6.4% | Finance Canada estimate; not the corporate income-tax rate. |
Sources: [1]-[5], [27].
Canadian real GDP increased 0.8% in the second quarter, while monthly GDP was essentially unchanged in July. The unemployment rate was 6.4% in August. CPI inflation was 3.0% year over year. Canadian business labour productivity increased 1.0% in the second quarter. And Finance Canada estimates that the proposed Productivity Mega Deduction would reduce the marginal effective tax rate on new investment to 6.4%, compared with 16.9% in the United States under Finance Canada’s modelling. [1][2][3][4][5][27]
The last number requires care. A 6.4% METR is not a 6.4% corporate income-tax rate. Alberta’s combined general federal-provincial corporate income-tax rate remains 23%, while British Columbia and Saskatchewan are generally 27% before special incentives. METR instead models the tax burden on a marginal new investment after considering depreciation deductions, sales taxes on capital, credits and other features. [27][30][31]
Three decisions for October
Protect: convert the tariff debate into a product-level schedule. For every material U.S. sale and U.S. purchase, identify the tariff classification, origin, current duty, customer or supplier responsibility, and cash-flow effect. A family enterprise cannot manage a headline tariff; it can manage a quantified exposure.
Adapt: revisit the capital budget. The proposed Productivity Mega Deduction, RTRI funding, provincial productivity incentives and lower Canadian financing rates can materially alter project economics. The appropriate response is not to buy assets merely for a deduction, but to rerun the after-tax net present value of equipment, automation, software, AI and market-entry projects that were already commercially defensible. [27][32][40][42][45][46]
Grow: require management to identify one credible non-U.S. growth corridor. Canadian exports to destinations other than the United States reached a record $25.6 billion in July, representing 33.7% of merchandise exports that month. That is not proof that diversification is complete; it is evidence that trade flows can move. [6]
Evidence key: measured observations are described as facts. Government forecasts and government-modelled tax comparisons are identified as such. Proposed legislation is not treated as enacted law. Planning examples are illustrations, not predictions.
01 Economic Update at a Glance
A rebound with less room for complacency
A family business does not experience the economy as a quarterly GDP release. It experiences the economy when a customer delays an order, when a supplier changes terms, when a lender asks for an updated forecast, when a key employee becomes easier or harder to hire, and when an investment that looked marginal six months earlier suddenly becomes compelling because financing, tax or competitive conditions have changed. The purpose of this monthly update is to translate official data into those operating decisions.
Canada’s second quarter was better than many businesses feared. Statistics Canada reported that real GDP increased 0.8% quarter over quarter in Q2 2026, following a much softer first quarter. Household consumption, exports and business capital investment all contributed. Investment in engineering structures increased, machinery and equipment strengthened, and spending on computers and peripherals rose sharply. [1] That combination matters because a recovery driven only by consumption would say something different from a recovery that also includes productive capital formation.
The next data point was less reassuring. Real GDP by industry was essentially unchanged in July. Ten of twenty sectors expanded, and construction increased 1.3% for a fourth consecutive month, but the aggregate economy did not extend the Q2 pace into the first month of Q3. [2] It is too early to call that a reversal. It is equally premature to extrapolate Q2’s strength through the rest of the year.
The labour market remains Canada’s clearest sign of slack. Employment declined by 42,000 in August and the unemployment rate remained 6.4%. Manufacturing employment increased by 22,000, which is encouraging for an economy trying to invest and retool, but employment fell in natural resources, utilities and business/building support services. Statistics Canada also reported a higher share of long-duration unemployment than the pre-pandemic norm. [3] For family enterprises, that means the labour market may be more favourable for selective hiring than the unemployment rate alone suggests, but weak employment growth also constrains household spending and can signal caution among employers.
Inflation remains uncomfortable rather than uncontrolled. CPI increased 3.0% year over year in August, with CPI excluding gasoline at 2.4%. Food purchased from stores increased 2.8%, shelter 1.5%, and transportation 7.5%. [4] The Bank of Canada held its policy rate at 2.25% on September 2 and emphasized the tension between softer growth risks and inflation pressure associated with tariffs and high energy prices. [8] That policy mix is useful for borrowers relative to the higher U.S. rate environment, but it also reflects Canada’s weaker demand conditions.
Productivity is one of the most constructive numbers in the October file. Business labour productivity increased 1.0% in Q2, the largest quarterly increase since the pandemic-distorted second quarter of 2020. Goods-producing businesses increased productivity by 1.7%. [5] One quarter does not resolve Canada’s long-standing productivity challenge, but the direction is important. If the trade shock causes businesses to invest in better equipment, software, process redesign and market discipline, part of the adjustment can raise long-term productive capacity rather than merely destroy margin.
The United States remains an essential comparison because it is Canada’s largest customer, supplier and competitor for capital. The U.S. labour market remains considerably tighter: August nonfarm payrolls increased by 162,000 and unemployment was 4.1%. U.S. CPI was 3.4% year over year in August. U.S. nonfarm business productivity increased at a 1.4% annualized rate in Q2 and 2.2% year over year. The Federal Reserve raised its target range by 25 basis points to 3.75%-4.00% on September 16, describing economic activity as expanding at a solid pace with resilient domestic spending and robust capital investment. [11][12][13][14]
The U.S. Bureau of Economic Analysis released its third estimate of Q2 GDP on September 30. The official release revised Q2 real GDP growth to 2.2% annualized and Q1 to 2.5% annualized. For comparability, Canada’s 0.8% quarterly Q2 increase is roughly 3.2% at a simple annualized rate. The point is not that one economy has permanently overtaken the other. It is that Canada had a strong Q2 rebound while the United States continued to show firmer underlying domestic demand and labour-market conditions. [15]
Trade data tell perhaps the most interesting October story. Canada’s total merchandise exports fell 2.3% in July and its goods trade surplus narrowed to $769 million. Yet exports to countries other than the United States rose 7.4% to a record $25.6 billion, representing 33.7% of Canadian merchandise exports. Canada’s trade surplus with the United States fell from $10.3 billion in June to $5.9 billion in July. [6] Some of the non-U.S. increase reflected commodity-specific movements, so it would be wrong to conclude that Canadian manufacturers have already replaced U.S. customers with European or Asian customers. But the geographic mix changed materially, and the Bank of Canada now reports mounting evidence that companies are adjusting supply chains and looking beyond the United States for growth. [9][10]
There is also direct business evidence of tariff transmission. Statistics Canada’s Q3 Canadian Survey on Business Conditions found that 32.2% of businesses expected U.S. tariffs on Canadian imports to have a negative impact over the following 12 months. The concern was highest in manufacturing, transportation and warehousing, and wholesale trade. More than one-quarter of businesses had already passed tariff-related cost increases to customers, and 30.4% said they were likely to do so over the next year. [7] Tariffs are therefore no longer confined to customs departments. They are moving through pricing, procurement and customer behaviour.
For October, the data support four operating conclusions. First, Canada is not in a broad recession on the latest measured data. Second, the recovery remains fragile because the labour market is soft and July growth stalled. Third, diversification is visible but incomplete. Fourth, the September escalation has not yet flowed through most of the official statistics. Family enterprises should therefore operate from current cash and order-book data rather than assuming the macro releases have already captured the new environment.
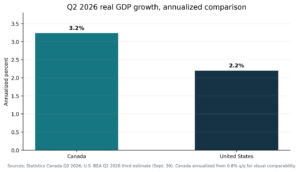
Figure 1 | Q2 real GDP growth on a comparable annualized basis
Official sources: Statistics Canada [1] and U.S. BEA [15].
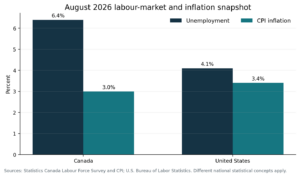
Figure 2 | August labour-market and inflation snapshot
Official sources: Statistics Canada [3][4] and U.S. BLS [11][12].
02 How We Got Here: Integration, Dependence and the Return of Tariffs
Sixty years of deliberate integration cannot be unwound in sixty days
The current Canada-U.S. trade conflict is easier to understand when it is viewed as a disruption to a production system that governments and businesses spent generations building. Canada did not accidentally become highly integrated with the United States. The two countries repeatedly chose rules that reduced border friction, encouraged continental supply chains and made location decisions on the assumption that qualifying goods could move across the border with limited tariff cost.
The 1965 Automotive Products Trade Agreement was one of the earliest major steps toward sectoral integration. It changed the economics of automobile manufacturing by allowing qualifying vehicles and parts to move duty-free while linking Canadian production to a larger continental market. Over time, assembly plants, parts suppliers, tool-and-die businesses, logistics networks and engineering capacity evolved around that integrated model. The result is why a modern tariff on an automotive input can affect a part that crosses the border more than once before a finished vehicle is sold.
The 1989 Canada-U.S. Free Trade Agreement widened the concept from a sector-specific bargain to broad economic integration. The agreement progressively removed tariffs, addressed non-tariff barriers, established rules of origin and deepened the legal framework for trade in goods and services. Global Affairs Canada describes CUSFTA as a major liberalization of bilateral commerce and an important foundation for what followed. [23]
NAFTA, effective in 1994, added Mexico and created a continental framework for goods, services, investment and dispute resolution. Supply chains were no longer simply Canada-U.S. chains; in many industries they became North American chains. Automotive content rules, investment protections and tariff elimination encouraged firms to allocate production by comparative advantage rather than national border. For Canadian SMEs, particularly manufacturers, the practical consequence was access to a much larger customer and supplier network than the domestic market alone could provide.
CUSMA replaced NAFTA on July 1, 2020 after a renegotiation that preserved the central tariff-free architecture but tightened important rules. Automotive regional-value content increased, labour-value requirements were introduced, steel and aluminum sourcing requirements became more demanding, digital trade rules were modernized, and state-to-state dispute settlement was strengthened. The agreement also contains a review architecture and withdrawal provisions that create recurring political and commercial uncertainty even though the treaty remains in force. [23][24][25][26]
The trade relationship had already become more complicated before CUSMA entered into force. In 2018 the United States used Section 232 national-security authority to impose tariffs on steel and aluminum. Canada retaliated. The parties then negotiated side arrangements, including a November 2018 exchange regarding future Section 232 measures and a May 2019 joint statement that removed the then-existing steel and aluminum tariffs while creating monitoring and consultation mechanisms. Those instruments matter because they demonstrate that the parties understood sectoral emergency tariffs to be a recurring risk even while negotiating a new free-trade agreement.
From 2025 onward, the tariff environment changed more fundamentally. The United States increasingly used domestic trade authorities to impose sectoral and country-specific measures. Canada responded with countermeasures and support packages. For businesses, the significance was not simply a higher customs bill. It was the erosion of an assumption that tariff-free North American access would remain the baseline for qualifying goods.
The 2026 escalation added Section 338 of the U.S. Tariff Act of 1930 to the practical risk map. The U.S. administration used Section 338 to impose additional duties on selected Canadian products based on its findings of discrimination affecting U.S. commerce. Canada disputes the underlying rationale and responded with matching counter-tariffs. On September 8, Canada implemented new countermeasures on $27.6 billion of U.S. imports at rates of 15%, 25% and 50%, with product rates designed to match corresponding U.S. measures. [17]
The same day, the United States announced further targeted action. In selected categories related to alcohol, dairy and motor vehicles, U.S. proclamations moved specified Canadian products from additional 50% duties to outright exclusion from importation effective September 29. [19][20][21] These are targeted classifications, not a general embargo on Canadian trade. That distinction matters. But the mechanism matters too: for an affected exporter, a prohibition is fundamentally different from a tariff because there is no price at which the covered product can simply absorb the border charge and continue entering the market.
CUSMA remains operative. Article 2.4 of the agreement contains the core rule against increasing existing customs duties or adopting new customs duties on originating goods except as otherwise provided. Chapter 31 establishes state-to-state dispute settlement. Chapter 32 contains exceptions, including essential-security provisions. Chapter 34 contains review and withdrawal rules. [23][24][25][26] The existence of those treaty rules does not automatically stop a domestic tariff at the border; governments can enact and administer domestic measures while treaty disputes proceed. That is why legal validity under domestic law and consistency with an international trade agreement are distinct questions.
For a family enterprise, the historical lesson is practical. North American integration created real efficiencies, but it also concentrated risk. A business that optimized around one border, one customer market and one supplier geography may now discover that yesterday’s efficiency is today’s vulnerability. The response should not be to discard sixty years of profitable U.S. relationships. It should be to distinguish relationships that remain economically compelling from concentrations that exist only because the old rules made alternatives unnecessary.
The October planning question is therefore not whether Canada and the United States will continue to trade. They will. The question is how much uncertainty a family enterprise can absorb while governments renegotiate the terms around that trade. Businesses with optional suppliers, multiple customer markets, strong origin documentation and liquidity have choices. Businesses without those features can be forced into decisions by customs rules rather than by strategy.
03 The Trade War This Month: September Escalation, CUSMA and the Cost of Uncertainty
September moved the dispute from announced measures to operating reality
September was important because several measures discussed in August became actual operating conditions. Canada’s new counter-tariffs took effect at 12:01 a.m. on September 8. They apply to $27.6 billion of U.S. imports at 15%, 25% or 50%, depending on the product, and are concentrated in sectors including steel and aluminum, dairy, appliances, agricultural equipment, pulp and paper, plastics and electronics. [17]
For Canadian importers, the first task is not political analysis. It is customs analysis. A company should identify which imported goods are actually covered, whether they originate in the United States for purposes of the measure, who is importer of record, whether alternative sourcing is commercially reasonable, and whether remission or duties-relief mechanisms apply. A 25% tariff on an input that represents 8% of revenue is a different problem from a 50% tariff on a rarely purchased capital item. The management response must be product-specific.
The federal remission framework remains important. Finance Canada states that exceptional remission requests can be considered where inputs cannot be sourced domestically, either nationally or regionally, or reasonably from non-U.S. sources, among other circumstances. [18] For the right business, remission can be worth more than a grant because it eliminates or refunds the tariff itself. A $2 million annual U.S. input subject to a 25% Canadian counter-tariff represents a gross $500,000 customs exposure before considering relief, pricing changes or sourcing alternatives.
On the U.S. side, September 8 brought targeted import exclusions. The White House proclamations concerning specified alcoholic beverages, dairy-related products and motor-vehicle-related products made certain listed Canadian goods ineligible for importation after September 29. [19][20][21] The U.S. administration framed those actions as responses to what it considers discriminatory Canadian treatment of U.S. commerce. Canada does not share that characterization. The neutral business fact is that affected tariff classifications moved from a regime where goods could enter at a high additional duty to a regime where the listed products are excluded.
The United States Trade Representative described the September 8 package as a combination of targeted import bans and recalibration of underlying Section 338 tariffs. [22] For family enterprises outside the directly affected classifications, the significance is precedent and policy risk rather than immediate prohibition. Management should ask whether its products could become targets in a subsequent round and whether contractual, inventory or market alternatives can reduce exposure.
CUSMA is the legal firewall that still protects a substantial portion of North American trade. The Bank of Canada observed on September 24 that many trade-related sectors have been less affected than initially feared in part because CUSMA continues to protect many Canadian goods and services from tariffs. [10] That observation should not be read as assurance that CUSMA eliminates all current risk. Rather, it explains why the dispute is severe for particular sectors without yet amounting to a universal tariff wall across all bilateral commerce.
Chapter 31 remains central because it provides a rules-based process for consultations, panels, compliance and, ultimately, suspension of benefits where a party fails to bring a measure into conformity. [24] For businesses, however, treaty litigation is not a cash-flow solution. A panel can clarify state obligations; it does not reimburse an SME for every margin dollar lost while the dispute proceeds. That is why the legal strategy of governments and the operating strategy of companies must be considered separately.
The trade war also has an indirect channel: uncertainty. The Bank of Canada has repeatedly emphasized that uncertainty about the future Canada-U.S. relationship can weigh on investment and hiring even where a company’s own goods are not tariffed. [8][9][10] A board delays a plant expansion because it cannot model market access. A customer reduces orders because it fears another tariff round. A supplier insists on shorter terms because it wants less receivable exposure. These effects are harder to measure than customs collections but can be economically broader.
Statistics Canada’s business survey shows that the transmission is already occurring. In Q3, 32.2% of businesses expected U.S. tariffs to have a negative impact over the next year. Manufacturing, transportation/warehousing and wholesale were the most concerned. Some 27.4% of businesses had passed tariff-related cost increases to customers, while another 30.4% reported they were likely to pass such costs on over the next year. [7] This is the bridge from trade policy to inflation and household purchasing power.
For a family enterprise, October should therefore include a formal tariff governance process. Management should maintain a live schedule of affected tariff classifications; record actual tariffs paid and recovered from customers; separate temporary working-capital effects from permanent margin erosion; document alternative-source tests where remission may be sought; and model at least three scenarios for 2027. That is more valuable than trying to predict the next proclamation.
A useful scenario framework is straightforward. In the base case, current tariffs persist but do not broaden materially. In the adverse case, tariffs spread to additional products or the company loses a material U.S. customer. In the opportunity case, tariff barriers create domestic substitution demand or weaken a competitor enough to permit acquisition or market-share gains. The family should know in advance what cash balance, leverage and capital-spending rules apply in each case.
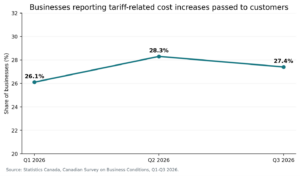
Figure 3 | Tariff cost pass-through is already visible
Official source: Statistics Canada [7].
04 Canada-U.S. Economic Scorecard: What the Data Say, and What They Do Not
Compare measures before drawing conclusions
Economic comparisons are useful only when the measures are comparable. Canada reports quarterly GDP primarily as a quarter-over-quarter percentage, while the United States usually headlines an annualized quarterly rate. Canada and the United States also differ in labour-force definitions, inflation baskets and sector composition. The purpose of a scorecard is therefore not to declare a winner. It is to identify the conditions that matter to a Canadian family enterprise.
Growth: Canada’s Q2 real GDP increase of 0.8% quarter over quarter was a strong rebound. Annualized mechanically, that is roughly 3.2%. The U.S. BEA’s September 30 third estimate reported 2.2% annualized growth in Q2, with Q1 revised to 2.5%. [1][15] The latest Canadian monthly data then showed no growth in July. [2] The relevant conclusion is that Canada had a strong Q2 but entered Q3 without obvious momentum, while the U.S. continued to expand at a solid pace.
Labour: Canada’s 6.4% unemployment rate is materially above the U.S. 4.1% rate. Canada lost 42,000 jobs in August while U.S. payroll employment increased by 162,000. [3][11] The practical implication is a softer Canadian labour market. For employers, that can ease recruitment and wage pressure in some occupations. For customer-facing businesses, it can also weaken household demand. A family enterprise should not treat softer labour as purely positive or negative; it changes both the cost of hiring and the strength of the customer base.
Inflation: Canadian headline CPI was 3.0% in August compared with 3.4% in the United States. [4][12] Canada therefore has a somewhat lower headline inflation rate on the latest readings, but both remain above the 2% level associated with the central banks’ price-stability objectives. More importantly for businesses, headline CPI does not measure a company’s own input basket. Transportation inflation in Canada was 7.5%, and tariffed inputs can move very differently from consumer prices. [4]
Interest rates: the Bank of Canada’s policy rate remained 2.25% after its September 2 decision. The Federal Reserve raised its target range to 3.75%-4.00% on September 16. [8][14] Canadian borrowers therefore face a materially lower central-bank policy rate environment. That can support capital investment and debt service. Yet the rate gap partly reflects different demand and inflation conditions. Lower rates are an opportunity to finance productive assets; they are not evidence that the underlying Canadian economy is stronger.
Productivity: Canadian business labour productivity increased 1.0% quarter over quarter in Q2. U.S. nonfarm business productivity increased at a 1.4% annualized rate and 2.2% year over year. [5][13] Different reporting conventions make a single-quarter comparison awkward, but both countries showed productivity improvement. Canada’s result matters disproportionately because weak productivity growth has been a persistent structural problem. One quarter is encouraging; a sustained trend would be transformational.
Trade: Canada’s July merchandise exports to non-U.S. destinations rose to a record $25.6 billion while total exports fell and the U.S. surplus narrowed. [6] The U.S. continued to run a large overall goods-and-services trade deficit, though its year-to-date deficit was below the same period a year earlier. [16] A trade surplus is not automatically evidence of economic strength and a deficit is not automatically evidence of weakness. For a family enterprise, the relevant statistic is the direction of demand in its actual customer markets and the cost of imported inputs.
Capital investment: this may become the most consequential comparison over the next two years. The Federal Reserve described U.S. capital investment as robust in September. [14] Canada, meanwhile, showed stronger Q2 machinery-and-equipment investment and has now proposed a much broader immediate-expensing regime intended to reduce the tax cost of investment. [1][27] The policy question is whether the new tax treatment and financing programs translate into actual business investment rather than merely changing the timing of deductions on projects that would have occurred anyway.
Business confidence: the Bank of Canada says businesses are adapting, adjusting supply chains and looking beyond the United States, but uncertainty remains a brake on investment. [9][10] That is consistent with the mixed statistical picture. An enterprise can have strong current orders and still postpone a five-year plant expansion because the board cannot confidently model border access. The aggregate economy can therefore appear stable while long-run productive capacity is quietly weakened.
For Western Canadian family enterprises, provincial structure matters. Alberta has greater exposure to energy and industrial investment, British Columbia to Pacific trade, forestry and real estate, and Saskatchewan to agriculture, resources and manufacturing. National indicators are a baseline, not a substitute for a sector and regional forecast. The family’s own dashboard should therefore track orders, backlog, gross margin, receivable days, inventory turns, covenant headroom, employee turnover and capital commitments alongside GDP and inflation.
October’s economic scorecard supports a balanced planning posture. There is enough growth and investment evidence to justify continuing high-return projects. There is enough labour and trade uncertainty to justify larger liquidity buffers and more conservative distributions. The discipline is to avoid using one strong GDP quarter as an excuse for complacency or one tariff headline as an excuse to stop investing.
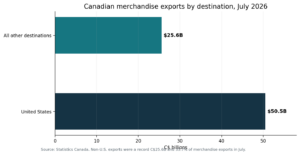
Figure 4 | July exports show a larger non-U.S. share
Official source: Statistics Canada [6].
05 The Investment Turn: The Productivity Mega Deduction, METR and Canada’s Capital Challenge
The biggest tax announcement of September changes timing, not the need for commercial judgment
The September 15 investment announcements could become one of the most important business-tax changes of this cycle. Finance Canada released draft legislative proposals for a Productivity Mega Deduction intended to make immediate expensing available for a much broader range of capital assets. The government estimates that assets representing more than 65% of capital investment would become eligible for immediate expensing, compared with roughly 15% under the prior framework. [27][28]
The proposed measure generally applies to qualifying property acquired on or after September 15, 2026 and would allow a full deduction in the year the property becomes available for use. Finance identifies categories including machinery, computer equipment, software, patents, fibre-optic infrastructure, mining property, pipelines and transportation infrastructure, subject to detailed class rules and exclusions. Certain buildings, goodwill and specified vehicles remain outside the broad immediate-expensing treatment, while separate rules continue for qualifying manufacturing and processing buildings. [27][28]
Legislative status is critical. As of this update’s September 30 information cut-off, Finance Canada has published draft legislative proposals. Businesses should therefore model the Mega Deduction as proposed law rather than treating it as enacted until Parliament completes the legislative process and Royal Assent is obtained. [28] Capital commitments should not be accelerated solely on the assumption that draft wording cannot change.
Finance Canada’s headline comparison is the marginal effective tax rate, or METR. The department estimates that Canada’s METR on new business investment would fall from 13.0% after the Spring Economic Update measures to 6.4% after the Productivity Mega Deduction. It estimates the comparable U.S. METR at 16.9% and the OECD average excluding Canada at 19.0%. [27] These are government-modelled figures, not statutory tax rates and not a guarantee of the tax burden on any particular company.
METR asks a different question from the corporate income-tax rate. It attempts to measure the tax wedge on a hypothetical marginal investment after accounting for deductions, tax credits, unrecoverable sales taxes on capital and other features. A company earning $1 million of taxable general-rate income in Alberta does not pay 6.4% corporate tax. The federal general corporate rate is 15% and Alberta’s general provincial rate is 8%, for a combined 23% before credits and other adjustments. British Columbia and Saskatchewan generally have 12% provincial general rates, producing a 27% combined federal-provincial rate. [30][31]
Small-business rates are also separate. The federal small-business rate for qualifying CCPC active business income is 9%, subject to the business limit and associated-corporation, taxable-capital and passive-income rules. Alberta and British Columbia have 2% provincial small-business rates; Saskatchewan’s lower corporate rate is 1% with its own business-limit parameters. [30][31] None of these statutory rates turns into 6.4% because the Mega Deduction is introduced.
The economic value of immediate expensing comes primarily from timing. Consider an Alberta general-rate corporation that acquires $1 million of qualifying equipment and has enough taxable income to use a full first-year deduction. At a 23% combined rate, the deduction could reduce current tax by up to $230,000 relative to no deduction. The true incremental benefit is smaller because the company would otherwise have received capital cost allowance deductions over time. The economic gain is the present value of receiving deductions earlier, plus any effect on financing capacity and project risk.
That distinction should shape client advice. A bad $1 million machine does not become a good investment because it creates a deduction. A good $1 million automation project may become more attractive if a large portion of the tax shield is available immediately, particularly when combined with lower borrowing costs or a program contribution. The correct model compares the after-tax cash flows under the existing and proposed rules, not the headline METR.
Finance Canada’s sector table is also instructive. Under its modelling, the proposed METR is -1.2% for manufacturing and processing, 1.8% for forestry, 9.9% for services, 13.0% for construction, -2.3% for transportation and storage, and 18.6% for wholesale trade. [27] A negative modelled METR can occur when tax incentives are sufficiently generous relative to the assumed marginal investment; it does not mean the government pays all tax for a profitable operating company. Again, the metric is an investment incentive measure.
The policy objective is explicit: increase business investment, productivity and job creation. The federal government also used the September Canada Investment Summit to announce or highlight nearly $500 billion of investment and financing commitments, faster project-approval ambitions and financing initiatives. [29] Commitments should not be treated as completed investment or added mechanically to GDP. Their economic value depends on execution, additionality, timing, import content, domestic supply-chain participation and whether the projects generate durable productivity gains.
For a family enterprise, the October capital-budget meeting should include six questions. Is the project commercially necessary? Does the asset qualify under the draft immediate-expensing rules? When will it become available for use? Does the corporation have enough taxable income to use the deduction efficiently? Can a grant, repayable contribution or credit be combined without reducing another benefit? And does the project reduce a strategic vulnerability—labour dependency, tariff exposure, customer concentration or unit cost?
The most compelling projects are likely those that improve both resilience and productivity. Automation that allows a Canadian manufacturer to compete in Europe; software that reduces inventory requirements; equipment that makes a previously imported component economical to produce domestically; or data infrastructure that enables a services firm to export more efficiently all address more than tax. They improve the operating model.
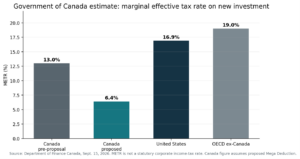
Figure 5 | Finance Canada’s modelled investment-tax comparison
Official source: Department of Finance Canada [27]. Proposed Canadian measure
06 Family Enterprises: Where the Trade Shock Reaches the Income Statement
Tariffs are not an abstract percentage once they enter gross margin
The income statement of a family enterprise is where trade policy becomes real. An exporter may face a tariff that raises the customer’s landed cost. An importer may face a Canadian counter-tariff on an input. A double-exposed manufacturer may face both. A domestic services business may never clear customs but still lose work when its manufacturing clients defer expansion. The transmission differs by industry, but the planning framework is consistent.
Start with revenue. A Canadian exporter to the United States should separate revenue into three categories: products unaffected by current measures; products subject to additional duties; and products at risk of future measures because they fall within a targeted sector. For tariffed products, management should know whether the U.S. customer is absorbing the tariff, demanding a price concession, reducing volume, switching suppliers or attempting to redesign the product’s origin. Revenue exposure is therefore not the value of exports alone. It is export value multiplied by the probability and margin consequence of customer behaviour.
Next examine cost of goods sold. Canada’s September 8 counter-tariffs can raise the landed cost of U.S. steel, aluminum, machinery, electronics, agricultural equipment, plastics and other specified goods. [17] A business should distinguish inputs that can be substituted quickly from those tied to engineering specifications, warranties, safety approvals or long-term supplier relationships. The theoretical availability of a non-U.S. supplier is not the same as a commercially reasonable alternative. That distinction is also relevant to remission requests. [18]
The third channel is working capital. Tariffs are often payable before the business collects from its customer. Inventory may need to be carried for longer when firms qualify new suppliers. Export diversification can lengthen receivable cycles as a business enters markets where customers expect different payment terms. The result is that a business can remain profitable on paper while requiring materially more cash to support the same revenue.
This is why Vivek Ramachandran’s emphasis on optionality and working capital is useful as a management framework, even though this publication relies on government sources for factual claims. The business logic is straightforward: liquidity gives management time to source alternatives, carry inventory, extend customer terms or survive a delayed order. A company with no liquidity may have to accept uneconomic terms simply because it cannot wait.
Fourth is capital expenditure. Some businesses respond to uncertainty by freezing all investment. That protects short-term cash but can compound long-term weakness if competitors automate, reduce unit costs or qualify new markets. The Q2 productivity and capital-investment data suggest that at least some Canadian businesses are continuing to invest. [1][5] The proposed Mega Deduction and current support programs are intended to reinforce that behaviour. [27][32][33]
Fifth is pricing. Statistics Canada’s Q3 survey shows that 27.4% of businesses had already passed tariff-related cost increases on to customers. [7] Price increases can preserve gross margin but reduce volume; absorbing the cost can preserve volume but compress margin. The correct choice depends on elasticity, competitive alternatives and customer concentration. Family enterprises often underprice disruption because owner-managers value long relationships. Relationship capital matters, but it should not hide the economics.
The effect on EBITDA can be disproportionate. Consider a business with $20 million of revenue, $12 million of cost of goods sold and $4 million of operating expenses, producing $4 million of EBITDA. If tariff and supply-chain costs increase COGS by only 5% and the company can recover half through pricing, EBITDA falls by approximately $300,000. If volume also declines 5% without equivalent cost reductions, the EBITDA impact can become much larger. Small changes above the EBITDA line are magnified because fixed costs do not fall automatically with revenue.
The family should also identify second-order exposure. A Western Canadian accounting, legal, engineering or IT firm may have no direct tariff classification, yet a meaningful share of revenue can depend on tariff-sensitive clients. A construction business can be affected by steel and equipment costs. An oilfield service company can face higher machinery costs while benefiting from stronger energy investment. A retailer can see both Canadian-substitution demand and higher import costs. Risk mapping should therefore follow customer industries and supplier inputs, not just the company’s own NAICS code.
Sector concentration matters. Statistics Canada’s Q3 survey found that manufacturing, transportation and warehousing, and wholesale trade were the sectors most likely to expect negative U.S.-tariff impacts. [7] The Bank of Canada specifically identifies automotive, steel, aluminum and lumber as hard-hit sectors. [10] Those are useful macro flags, but a strong individual company can still outperform a weak sector if it has a cost advantage, differentiated product or stronger balance sheet.
October’s operating discipline should be to convert uncertainty into measurable ranges. Every exposed family enterprise should have a 13-week cash forecast, a 12-month integrated forecast, an EBITDA sensitivity table and a tariff register. Boards should distinguish controllable responses—price, sourcing, inventory, capex, financing—from uncontrollable events. The point is not to predict every tariff. It is to know which decisions management will take when a threshold is crossed.
07 Family Wealth: Protect the Balance Sheet Behind the Business
Business risk becomes family risk when wealth is concentrated
For many business-owning families, the operating company is simultaneously a source of income, a retirement asset, a legacy asset and collateral—economically if not legally—for the family’s standard of living. That concentration can be rational because entrepreneurial wealth is often created by owning a successful business. It also means that a trade shock can affect the family’s income, enterprise value, real estate and investment portfolio at the same time.
The first family-wealth issue is valuation. Enterprise value is often described as EBITDA multiplied by a market multiple. A business producing $4 million of maintainable EBITDA at a 6x multiple has an illustrative enterprise value of $24 million. If tariff pressure, lost orders and higher input costs reduce maintainable EBITDA to $3 million, and uncertainty also reduces the applicable multiple to 5x, illustrative enterprise value falls to $15 million. A $1 million decline in earnings has translated into a $9 million decline in enterprise value before considering debt.
Debt then magnifies the equity effect. If the $24 million enterprise value sits above $6 million of net debt, family equity is $18 million. If the stressed enterprise value is $15 million and net debt rises to $7 million because working capital absorbed cash, family equity falls to $8 million. This is an illustration, not a forecast. Its purpose is to show why margin, valuation multiples and leverage should be reviewed together.
The second issue is liquidity. Net worth is not liquidity. A family can own a valuable company, commercial property and a residence yet have limited readily deployable capital. When the operating company needs $2 million to hold inventory and qualify a new market, the family may discover that much of its wealth is illiquid or correlated with the same economic shock.
A family liquidity policy can help. It can define a minimum operating-company cash buffer, a holding-company liquidity reserve, rules for dividends and shareholder draws, and the amount of personal liquidity the family wants outside the operating risk. The policy should respond to leverage and forecast uncertainty rather than to habit. In a high-uncertainty year, maintaining an extra quarter of fixed costs may have more option value than maximizing distributions.
The third issue is concentration across assets. The business may depend on U.S. customers; the family’s commercial real estate may be occupied by the business; the investment portfolio may be heavily Canadian; and retirement plans may assume a future sale of the company. Those are separate legal assets but a common economic exposure. Diversification of the family balance sheet is therefore different from diversification of the business’s customers. Both matter.
The fourth issue is succession timing. A temporary decline in enterprise value can be a threat if the owner needs to sell immediately. It can also create a planning window if the family intends an estate freeze, intergenerational transfer or management transition and the lower valuation is supportable. Sections 70, 85, 86, 84.1 and 110.6 of the Income Tax Act may become relevant depending on the strategy. [53][54][56][57][58] The tax technique should follow the commercial succession plan, not replace it.
The fifth issue is family employment and governance. A trade shock can turn strategic disagreements into family conflict: one generation wants to preserve cash; another wants to invest; a non-operating shareholder wants dividends; management wants to suspend them. A written capital-allocation policy is therefore a governance tool as much as a finance tool. It should state the order in which cash is used: operating needs, debt covenants, maintenance capex, strategic capex, acquisitions, taxes, distributions.
The sixth issue is insurance and estate liquidity. If the business value is volatile, the amount and purpose of insurance should be revisited. Insurance may fund tax at death, shareholder buy-sell obligations, debt or family equalization. A tariff shock does not automatically change insurance needs, but it can change the business value and the family’s capacity to fund obligations from operating cash.
The seventh issue is acquisition opportunity. A well-capitalized family enterprise can emerge from a difficult period with greater market share. Competitors may face refinancing pressure or succession problems. Suppliers may become available. A family with liquidity can acquire talent, equipment, customers or an entire business when others are forced to retrench. That is why preserving liquidity and continuing selective investment are not contradictory strategies.
The wealth objective for October is resilience with optionality. The family should know how much of its net worth depends on the enterprise, how much of the enterprise depends on the United States, how much debt must be serviced if EBITDA falls, and what capital remains available for opportunity. That is a more useful wealth statement than a single net-worth number.
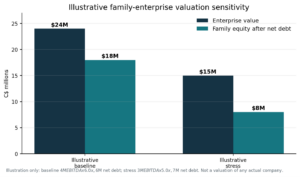
Figure 6 | Why a moderate earnings shock can produce a larger equity shock
Illustrative planning example only; not a market forecast or appraisal.
08 Diversification: Turn Free-Trade Access into Profitable Customers
July’s record non-U.S. exports are evidence of movement, not completion
Canada has one of the broadest networks of preferential trade agreements in the world, but legal access is not the same as commercial access. A tariff can be zero and a Canadian SME can still fail to sell because it lacks a distributor, certification, local marketing, financing or management capacity. Diversification therefore requires a commercial process rather than a map of treaty partners.
The July trade data provide evidence that Canadian trade flows are moving. Exports to destinations other than the United States increased 7.4% to a record $25.6 billion, or 33.7% of merchandise exports. Higher exports to the Netherlands, China and Germany were important contributors. [6] Some of that increase was commodity-driven, so it should not be interpreted as proof that every sector has successfully diversified. It nevertheless demonstrates that non-U.S. demand can absorb more Canadian output.
The Bank of Canada now says there is mounting evidence that businesses are adjusting supply chains and looking beyond the United States for growth. [9][10] It also notes that diversification is generally easier for globally traded commodities than for manufactured products, where relationships, certifications, logistics and competition can create higher barriers. [10] That observation is particularly important for family enterprises: the need to diversify does not eliminate the cost of diversification.
A disciplined market-entry process begins with product-market fit. Do not ask management to ‘expand into Europe.’ Ask whether one specific product has a landed-cost, quality or service advantage in one specific market. Determine the customer’s alternative suppliers, regulatory requirements, logistics, payment terms and expected margin. Then assess whether the relevant free-trade agreement improves the economics through tariff treatment or rules of origin.
For Alberta and Saskatchewan businesses, the United Kingdom, European Union, Australia, Japan and Mexico can be logical corridors depending on the sector. For British Columbia, Pacific markets can be especially relevant because geography can reduce freight disadvantages. The appropriate market is sector-specific. Agricultural equipment, professional services, food, industrial technology and energy services do not share the same commercial map.
The second step is channel. An SME can enter through a distributor, agent, direct sales force, e-commerce platform, joint venture, branch or subsidiary. The cheapest entry model is not always the best. A distributor can reduce fixed cost and regulatory complexity but takes margin and customer ownership. A subsidiary provides control but creates tax, payroll, legal and governance obligations. The structure should match the expected scale and strategic importance of the market.
The third step is financing. New markets consume working capital before they generate stable cash flow. EDC’s Trade Impact Program provides financing and insurance capacity for eligible Canadian exporters, while BDC’s tariff-response financing can support liquidity and pivot projects. [34][35] AgriMarketing provides non-repayable cost-sharing for eligible agriculture and food SMEs targeting new markets. [47] CanExport SMEs remains a valuable program to monitor, although the 2026-27 intake closed August 31; businesses should prepare projects for the next available intake rather than assume funding is currently open. [49]
The fourth step is commercial proof. A family enterprise should generally pilot before building a large foreign fixed-cost base. One product, one market, one channel and one pilot customer is a useful discipline. The pilot should produce enough information to decide whether to scale: gross margin after freight and duties, customer-acquisition cost, receivable behaviour, service burden and repeat-order potential.
The fifth step is tax and legal architecture. Foreign expansion can raise transfer-pricing issues under section 247, foreign-affiliate reporting and income questions, withholding taxes, permanent-establishment risk, indirect tax and local payroll obligations. [59][60] Those issues should be designed around the commercial model. Tax should not force a subsidiary where a distributor relationship is more sensible, nor should a business accidentally create a permanent establishment because it did not review how employees or agents operate abroad.
The sixth step is management capacity. Diversification is not free if the same team is already managing a tariff shock at home. A market-entry plan should identify an accountable executive, budget, milestones and stop-loss criteria. A family enterprise that pursues five countries at once can dilute focus and create five expensive experiments. One or two well-chosen corridors are often more realistic.
Government programs can reduce the cost of learning. Alberta’s Level Up program offers workshops, coaching and market-support resources; the Alberta Export Expansion Program helps with eligible trade-event costs; PrairiesCan BSP can support scaling and market diversification; and federal Trade Commissioner services can help companies navigate markets. [38][39][45] The purpose of those programs should be to accelerate commercial capability, not to justify a weak market thesis.
The October diversification objective should be measurable. By month-end, management should be able to identify the top two non-U.S. markets by expected risk-adjusted contribution margin, the first ten target customers or partners in each, the regulatory barriers, the financing requirement and the first pilot step. Diversification becomes strategy only when it produces a pipeline.
09 Western Canada Support: Match the Program to the Problem
Grants matter, but the best support may be liquidity, tax relief or market access
The support landscape is now large enough that businesses can waste significant time pursuing programs that do not fit the underlying problem. A family enterprise should begin by identifying whether it needs tariff relief, liquidity, productive capital, export development, training or equity. The program should follow the business problem.
1. Regional Tariff Response Initiative – Alberta and Saskatchewan
PrairiesCan is accepting applications under the expanded RTRI. Eligible SMEs generally need at least $1 million of annual revenue, viability before the tariffs and a demonstrated direct or indirect tariff impact. Eligible businesses can receive non-repayable contributions up to $3 million in total: up to $1 million for an eligible pivot project and up to $2 million for eligible liquidity assistance. Applications are open until December 31, 2028 or until funding is used. [32]
Pivot projects can include productivity investment, new technology, supply-chain adaptation and market diversification. Liquidity support can help viable firms manage tariff-related cash pressure. For a family enterprise, this is one of the first programs to screen because it can address both immediate cash and structural adaptation.
2. Regional Tariff Response Initiative – British Columbia
PacifiCan is also accepting applications for the expanded RTRI in British Columbia. The national initiative totals $3.45 billion across regional development agencies and is intended to support liquidity, competitiveness, supply-chain resilience and market diversification. [33] B.C. companies should apply through PacifiCan rather than PrairiesCan.
3. BDC Pivot to Grow
BDC expanded Pivot to Grow in August. The new liquidity stream offers eligible tariff-affected Canadian businesses loans from $250,000 to $5 million, with 0% interest for the first 12 months, interest-only payments over 36 months and amortization over 96 months. The minimum revenue threshold was reduced to $1 million. [34] This is debt, not a grant. It is useful where the business is viable but the tariff shock creates a temporary financing need.
4. EDC Trade Impact Program
EDC’s Trade Impact Program provides additional financing and insurance capacity to eligible Canadian exporters. EDC reported in August that almost $3 billion had already been deployed from an up-to-$5-billion capacity commitment. [35] The program can help with working capital, supply-chain resilience, productivity and market diversification. For an exporter entering a new country, credit insurance and bank guarantees can be as valuable as a grant because they expand the amount of business the company can finance safely.
5. Work-Sharing and Worker Retention Grant
Work-Sharing can help an employer avoid layoffs when business activity falls temporarily for reasons beyond its control. Tariff special measures are extended to March 31, 2028 and can allow agreements up to 152 weeks, with expanded employer and employee eligibility. [36] Employers with an approved and implemented Work-Sharing agreement can also apply for the Worker Retention Grant. The grant is intended to keep employee income closer to normal wages while reduced-hour employees participate in training; applications are open to December 31, 2027. [37] Businesses should also note that the government has announced a proposed future Workforce Retention and Retraining Program; it is not yet a substitute for the currently operating programs. [36]
6. Alberta Export Expansion Program
Alberta’s AEEP provides grants for eligible international trade event participation. Funding includes per diems of $400 per day for a first traveller and $200 for a second, eligible registration reimbursement, and up to $15,000 of total grant funding per applicant per program year. The intake is continuous until the annual budget is committed. [38] For an export-ready family enterprise, the program is small relative to a major international expansion but useful for reducing the cost of disciplined market testing.
7. Alberta Level Up
Level Up is an Alberta-wide export resource hub delivered through a collaboration between the Government of Alberta and Calgary Economic Development. It provides expert-led workshops, personalized coaching and trade support to businesses ready to scale domestically and internationally. [39] It is not presented as a direct cash grant to individual companies. Its value is capability: market information, connections and execution support.
8. Alberta Manufacturing Productivity Grant
The Alberta Manufacturing Productivity Grant is a two-year pilot administered by Canadian Manufacturers & Exporters. More than $4 million is available, with eligible Alberta manufacturers able to access advice and up to $30,000 in matching funding for technology upgrades and new machinery and equipment. Eligible manufacturers generally need a physical Alberta manufacturing location, use the funded equipment in Alberta, and employ between 5 and 750 employees. [40]
9. B.C. Employer Training Grant
The B.C. Employer Training Grant funds 80% of eligible training cost up to $10,000 per employee, with a maximum of $300,000 per employer per year. Eligible employers and self-employed individuals must operate in B.C. and generally have been operational for at least one year. [41] This can be particularly useful where a tariff-affected company is automating and wants to retrain rather than replace its workforce.
10. B.C. Manufacturing and Processing Investment Tax Credit
B.C.’s new refundable manufacturing and processing investment tax credit applies to eligible investments by qualifying CCPCs in qualifying buildings and machinery/equipment used primarily in B.C. manufacturing and processing. The rate is 15% for eligible expenditures incurred from April 1, 2026 through March 31, 2031, with eligible investment generally capped at $2 million per property for purposes of the credit. [42] The program can therefore produce a maximum credit of up to $300,000 on a $2 million eligible investment, subject to the statutory rules.
11. Saskatchewan SME Investment Tax Credit
Saskatchewan’s SME Investment Tax Credit is a three-year pilot through June 30, 2028. It provides a 45% non-refundable tax credit to individuals and corporations that invest equity in eligible Saskatchewan SMEs in food and beverage manufacturing, machinery manufacturing or transportation-equipment manufacturing. Eligible businesses must generally have 5 to 49 employees with at least half resident in Saskatchewan and can raise up to $4 million of eligible investment. [43] This is an investor incentive rather than cash paid directly to the operating company, but it can lower the effective cost of raising expansion capital.
12. Saskatchewan Commercial Innovation Incentive
The Saskatchewan Commercial Innovation Incentive reduces the provincial corporate income-tax rate to 6% for 10 years on eligible income from commercializing qualifying intellectual property, with a possible 15-year benefit period where at least 50% of the related R&D occurred in Saskatchewan. [44] It is relevant to innovative family enterprises commercializing patents, software, algorithms, trade secrets and other qualifying IP.
13. PrairiesCan Business Scale-up and Productivity
BSP offers interest-free repayable funding from $200,000 to $5 million per project, generally up to 50% of eligible project costs, for high-growth incorporated businesses scaling innovative goods, services or technologies. [45] Eligible activities include productivity technology, commercialization and entry into global markets. The remaining project funding generally must come from non-government sources. This is particularly relevant to established family businesses that have outgrown small grants and need meaningful capital for scale.
14. PrairiesCan Regional Artificial Intelligence Initiative
For Alberta and Saskatchewan businesses adopting or commercializing AI, PrairiesCan’s RAII provides interest-free repayable contributions of $250,000 to $5 million, generally up to 50% of eligible costs for for-profit projects. [46] The program is intended to help SMEs integrate AI into operations, implement AI strategies and access skills. It should be considered only where the AI project solves a defined business problem and has measurable economics.
15. AgriMarketing Market Diversification for SMEs
Agriculture and Agri-Food Canada’s market-diversification stream is open through September 30, 2030 or until funding is committed. It provides non-repayable support normally below $100,000 per project, generally up to 70% of eligible costs, for qualifying agriculture, agri-food, agri-products, fish and seafood SMEs pursuing diversification. [47] Projects directly affected by trade disruption and those targeting new markets receive priority consideration.
16. FCC Trade Disruption Customer Support
FCC has extended its Trade Disruption Customer Support Program to March 5, 2027 for Canadian agriculture and food businesses. [48] The program focuses on financing and cash-flow solutions as farms, agribusinesses and food processors adapt to tariffs and input-price volatility. Financing remains subject to credit review; businesses should discuss options with FCC rather than treat the program as automatic relief.
17. CanExport SMEs
CanExport remains relevant for export diversification, but current intake status matters. The 2026-27 intake closed August 31. [49] Eligible businesses in that intake generally had 3 to 500 employees and annual revenue between $300,000 and $100 million. A family enterprise should build its market-entry project now and monitor the next intake rather than record a receivable for funding that is not currently open.
18. Tariff remission and CBSA duties relief
These are not conventional business-development programs, but for some importers they are the highest-value supports. Finance Canada can consider remission in exceptional circumstances such as where inputs cannot be sourced domestically or reasonably from non-U.S. sources. [18] CBSA’s Duties Relief Program and drawback mechanisms can also matter where imported goods are subsequently exported or incorporated into exported products. [50] Customs planning should therefore be part of the financing discussion.
The practical screening sequence is simple. If the problem is a Canadian tariff on an input, test remission and duties relief first. If the problem is liquidity, test RTRI and BDC. If the problem is export financing, test EDC. If the problem is productivity, layer RTRI, provincial credits and PrairiesCan programs. If the problem is labour retention, test Work-Sharing and training support. If the problem is market entry, use export programs and advisory infrastructure. The objective is not to collect programs. It is to build an economically coherent project and then reduce its risk or cost with programs that genuinely fit.
Western Canada program matrix
Use this as a screening tool, not as a substitute for the current program guide. Funding is generally discretionary and subject to eligibility, due diligence, available budget and program stacking rules.
| Program | Region | Type | Potential support | Who should screen it | Official details |
| RTRI – Prairies | AB / SK | Non-repayable + repayable | Up to $3M non-repayable; larger support possible | Tariff-affected viable SMEs; generally $1M+ revenue | [32] Details |
| RTRI – PacifiCan | BC | Non-repayable + repayable | Liquidity and pivot support; see current guide | Tariff-affected viable B.C. SMEs | [33] Details |
| BDC Pivot to Grow | All | Loan | $250K-$5M liquidity stream | Eligible tariff-affected Canadian businesses; $1M+ revenue for stream | [34] Details |
| EDC Trade Impact Program | All | Financing / insurance | Case-specific | Exporters needing working capital, insurance or market diversification | [35] Details |
| Work-Sharing | All | EI income support | Up to 152-week agreements under special measures | Temporary business-activity decline; 2+ EI-eligible employees | [36] Details |
| Worker Retention Grant | All | Grant / wage top-up | Case-specific | Approved and implemented Work-Sharing employer with training | [37] Details |
| Alberta Export Expansion | AB | Grant | Up to $15K / program year | Alberta exporter entering eligible market/event | [38] Details |
| Level Up | AB | Advisory / coaching | Program support, not direct cash award | Alberta business ready to scale domestically/internationally | [39] Details |
| AB Manufacturing Productivity Grant | AB | Matching grant | Up to $30K | Alberta manufacturer, generally 5-750 employees | [40] Details |
| B.C. Employer Training Grant | BC | Training grant | 80%, up to $10K/employee; $300K/employer/year | B.C. employer operating at least one year | [41] Details |
| B.C. M&P Investment Tax Credit | BC | Refundable tax credit | 15% on qualifying investment; statutory limits apply | Qualifying CCPC manufacturing/processing investment | [42] Details |
| SK SME Investment Tax Credit | SK | Investor tax credit | 45%; eligible SME may raise up to $4M | 5-49 employee eligible manufacturing SME | [43] Details |
| SK Commercial Innovation Incentive | SK | Corporate tax incentive | 6% provincial rate for 10 or 15 years on eligible income | Commercialization of qualifying IP in Saskatchewan | [44] Details |
| PrairiesCan BSP | AB / SK | Interest-free repayable | $200K-$5M per project | High-growth incorporated business scaling/productivity/global markets | [45] Details |
| PrairiesCan RAII | AB / SK | Interest-free repayable | $250K-$5M per project | AI adoption/commercialization; generally up to 50% eligible cost | [46] Details |
| AgriMarketing diversification | All | Non-repayable contribution | Normally < $100K; up to 70% cost share | Eligible agriculture/agri-food/fish/seafood SME | [47] Details |
| FCC Trade Disruption Support | All | Financing | Case-specific | Canadian agriculture and food businesses | [48] Details |
| CanExport SMEs | All | Grant | Next intake to be confirmed | Eligible exporters; 2026-27 intake closed Aug. 31 | [49] Details |
| Tariff remission / duties relief | All | Duty relief | Potential tariff avoided/refunded | Importers meeting remission or re-export/drawback conditions | [18] Details |
Program status and terms can change. Confirm the current guide before committing expenditure or recording assistance.
10 Productivity, AI and Capital Allocation: Invest Through the Shock, Not Blindly Into It
A trade war can destroy productive capacity or force better capital discipline
The long-term economic risk of the trade war is not simply the tariff collected this month. It is the possibility that uncertainty causes businesses to stop investing, reducing productivity and potential growth for years. The long-term opportunity is the opposite: disruption can force businesses to automate, improve processes, diversify suppliers and adopt technologies that make them more competitive even after tariffs change.
Canada’s Q2 productivity increase of 1.0% is therefore important. [5] It arrived alongside stronger business investment and rising spending on computers and peripherals. [1] The data are too short to establish a new trend, but they show that a period of trade uncertainty does not automatically produce an investment collapse.
AI should be considered within this productivity framework rather than as a separate technology fashion. Statistics Canada’s Q3 business survey found that 25.2% of businesses planned to use AI over the following 12 months, up materially from the same quarter a year earlier, while more than half still had no plans to use it. [7] The wide gap suggests that adoption is still early and uneven.
For a family enterprise, the best AI project is usually not ‘implement AI.’ It is a defined workflow with measurable labour, error, speed or revenue economics. Examples can include automated document classification, demand forecasting, preventive maintenance, sales lead prioritization, customer-service support or faster professional research. The project should have a baseline metric, implementation cost, control framework and payback target.
The trade-war connection is direct. A manufacturer losing margin to tariffs needs lower unit costs. A distributor facing longer supply chains needs better inventory forecasting. An exporter entering Europe needs faster translation, documentation and compliance workflows. A professional services firm supporting clients across jurisdictions needs more efficient research and knowledge management. Technology investment becomes valuable when it improves the economics of adaptation.
Government programs can reduce financing friction. PrairiesCan RAII supports larger AI adoption and commercialization projects. [46] Alberta’s Manufacturing Productivity Grant supports smaller equipment and technology investments. [40] B.C.’s Employer Training Grant can help train workers who must use new systems. [41] The proposed federal Mega Deduction may accelerate deductions for qualifying technology and software. [27][28] The interaction among these programs must be modelled carefully because government assistance can affect tax cost and other funding calculations.
Capital allocation should rank projects rather than approve everything that qualifies. A useful hierarchy is maintenance capex first, then safety/regulatory projects, then projects with clear productivity or market-access returns, then strategic options whose value is primarily resilience. Each project should be scored on after-tax NPV, payback, cash requirement, tariff sensitivity, labour impact and execution risk.
Family governance matters here because owner-managed businesses sometimes make capital decisions through intuition. Intuition is valuable, particularly where owners understand customers deeply, but large investments deserve a disciplined hurdle rate. A tax deduction reduces cost; a grant reduces cost; neither creates revenue. The commercial case must remain primary.
The proposed Mega Deduction also changes the timing question. If qualifying equipment is already scheduled for 2027, management should compare the economics of acquiring it after September 15, 2026 versus later, taking into account available-for-use rules, financing costs, project readiness and taxable income. [27][28] Accelerating delivery only to obtain a deduction can be counterproductive if installation is rushed or cash is constrained.
The October capital-allocation principle is therefore: protect the projects that improve the business’s future unit economics and optionality, cut projects whose only justification is optimism, and do not allow uncertainty to become an excuse for permanent underinvestment. Canada’s productivity challenge will not be solved by policy announcements. It will be solved if thousands of businesses deploy capital into assets and processes that generate more value per hour worked.
11 Tax Planning in the New Environment: Preserve Cash, Sequence Decisions and Document the Facts
Tax planning should support commercial resilience, not distract from it
A trade shock creates a temptation to search for a tax solution to an operating problem. Tax planning can preserve cash, accelerate deductions, use losses, improve succession flexibility and reduce the cost of investment. It cannot make an unprofitable customer profitable or replace a viable market. The correct sequence is commercial decision, financing decision, tax structure.
The first tax issue is the proposed Productivity Mega Deduction. Because the measure is draft legislation as of September 30, businesses should document acquisition dates, available-for-use dates, asset classes, related-party histories and expected taxable income while maintaining a scenario for legislative change. [28] The projected tax benefit should be separated from the project’s pre-tax return so the board can see whether the project remains defensible without the incentive.
The second issue is government assistance. Paragraph 12(1)(x) of the Income Tax Act can include certain government assistance in income unless another provision provides a different treatment or the amount reduces the cost or expense under applicable rules. [51] Grants and contributions can also affect the capital cost of depreciable property, SR&ED expenditure pools or the amount of other assistance. Every program application should therefore have a tax workstream before management treats the gross award as net cash benefit.
The third issue is losses. Section 111 governs the use of non-capital and net capital losses, subject to detailed restrictions. [52] A tariff-affected corporation that moves from profit to loss should model carrybacks, future utilization and the effect of acquisitions or changes in control. The value of a tax loss depends on when and where it can be used; it is not equivalent to cash at the statutory rate.
The fourth issue is corporate reorganization. Sections 85 and 86 can facilitate tax-deferred transfers and reorganizations where the commercial structure needs to change. [53][54] A family may want to separate a new export subsidiary, isolate real estate, bring in an investor or reorganize share classes before succession. Section 55 must be considered where intercorporate dividends form part of a reorganization. [55] These are technical provisions and should be implemented only with transaction-specific legal and tax advice.
The fifth issue is succession. Section 84.1 is central to certain non-arm’s-length share transfers, including qualifying intergenerational business-transfer structures, while section 110.6 governs the capital gains deduction and QSBC rules. [56][57] Trade-driven valuation changes can alter the economics of an estate freeze or sale. A lower defensible value can reduce the amount of future growth retained by the current generation, but a weak year should not be manufactured merely to obtain a valuation result.
The sixth issue is death and estate liquidity. Section 70 generally deems a disposition of capital property at death subject to applicable rollover provisions and other rules. [58] A family whose wealth is concentrated in private-company shares should compare expected tax and liquidity obligations with insurance, holding-company assets and estate cash. If the business is under trade pressure, relying on a future special dividend to fund tax may be less reliable than it appeared in a stable period.
The seventh issue is international expansion. Section 247 governs transfer pricing for non-arm’s-length cross-border transactions. [59] Foreign-affiliate rules and reporting can arise where a Canadian corporation owns foreign entities, and CRA’s T1134 information-return regime can be significant. [60] A diversification strategy therefore creates tax compliance as well as market opportunity. The cost belongs in the market-entry model from the start.
The eighth issue is customs. Income tax is only one tax system relevant to the trade war. Origin documentation, classification, valuation, remission, duties relief and drawback can be more valuable than an income-tax deduction. [18][50] A family enterprise should coordinate its tax adviser, customs broker, operations team and procurement team so that tariff decisions are made before goods arrive at the border, not after duty is paid.
The ninth issue is corporate rate comparison. Finance Canada’s 6.4% METR estimate should never be marketed as Canada’s corporate tax rate. [27] For a Western Canadian general-rate corporation, the statutory combined rate is generally 23% in Alberta and 27% in British Columbia or Saskatchewan before credits and special regimes. [30][31] For a qualifying CCPC on income eligible for the small-business deduction, lower rates can apply within business limits. The U.S. federal C-corporation rate is a separate statutory measure and state tax must be considered. A project location analysis should compare after-tax cash flows, not headlines.
The tenth issue is timing. In uncertain markets, deferral can have real option value. A transaction that is tax-efficient today may reduce flexibility if the business later needs outside capital, a sale or a different succession path. Tax planning should therefore be designed to preserve optionality where the commercial future is genuinely uncertain.
12 The October Family Enterprise Action Plan
Decisions before the next update
The value of an economic update is not that it predicts the next month perfectly. It is that it improves decisions before the next month arrives. October’s action plan is organized around thirty days, ninety days and twelve months because different risks require different time horizons.
The next 30 days: quantify and protect
First, close September with an actual tariff report. Record tariffs paid, tariff-related price increases obtained from customers, supplier surcharges, lost orders and delays. Compare actual results with the scenario assumptions used in September. A forecast that is not reconciled to actual results quickly becomes narrative rather than management information.
Second, update the 13-week cash-flow forecast weekly. Include customs payments, inventory builds, delayed receivables and capital commitments. Establish a minimum cash threshold and identify the facilities available if that threshold is breached. If liquidity assistance under RTRI or BDC may be required, begin the application before the business is in distress. [32][34]
Third, screen tariff relief. Identify U.S. inputs where Canadian or reasonable non-U.S. alternatives do not exist and determine whether remission should be explored. [18] Review duties relief or drawback if imported components are incorporated into exported products. [50]
Fourth, rerun the 2026-27 capital plan under the proposed Mega Deduction. Identify which assets could qualify, when they would become available for use, the current tax basis and the incremental present value of earlier deductions. [27][28] Keep the analysis explicitly labelled as proposed legislation until enacted.
Fifth, screen government programs using the problem-first matrix. Alberta and Saskatchewan tariff-affected SMEs should review PrairiesCan RTRI; B.C. companies should review PacifiCan RTRI; manufacturers should review provincial productivity credits; exporters should review EDC; and employers facing temporary reductions should review Work-Sharing. [32][33][35][36][40][41][42][43]
The next 90 days: adapt and test
Qualify at least one alternate supplier for every critical U.S.-sourced input that cannot be economically absorbed if tariffs increase. Qualification includes engineering, quality, freight, currency, lead time and working-capital requirements—not merely obtaining a quotation.
Select one non-U.S. market for a controlled pilot. Define the product, channel, first customer profile and budget. Use provincial export programs, Trade Commissioner resources and EDC where appropriate. Do not establish a foreign subsidiary simply because it appears sophisticated; choose the lightest structure that can prove the market.
Review the debt structure. Match long-lived capital assets with appropriate term financing rather than consuming operating lines. Preserve operating credit for working capital and shocks. Where an acquisition opportunity is likely, quantify unused borrowing capacity before a competitor comes to market.
Review pricing by customer. Identify customers where the enterprise is absorbing tariff cost without a strategic reason. Negotiate surcharges or revised terms where the relationship allows. Some businesses will choose to absorb costs temporarily to protect market share; that should be a deliberate investment decision with an expiry date.
Review succession valuation. If EBITDA or market multiples have changed materially, determine whether the current value creates a planning opportunity or a planning risk. Do not execute an estate freeze simply because value is lower; ensure the structure remains consistent with control, retirement-income and family-governance objectives.
The next 12 months: build a less concentrated enterprise
Set a target for U.S. customer concentration. The target should not be zero. The United States remains a large, proximate and often highly profitable market. The goal is to reduce the probability that one government action can determine the enterprise’s future.
Set a productivity target. Revenue growth without productivity growth can leave a business more complex but not more valuable. Track revenue and gross profit per employee, output per machine hour, inventory turns, error rates or another sector-appropriate measure. Link major capex to at least one productivity KPI.
Set a family liquidity target. Determine how much liquid capital should sit outside the operating company, how much debt the family is willing to tolerate at a stressed EBITDA level, and how distributions change when covenant headroom declines. A written policy makes difficult decisions easier when the family is under pressure.
Build an acquisition watchlist. Identify competitors, suppliers or distributors that would materially improve the enterprise if available at the right price. Track succession risk, financial pressure and strategic fit. The best acquisition can arise during a period when the buyer is prepared and others are defensive.
Ten questions for the family meeting
- What percentage of enterprise revenue ultimately depends on U.S. demand?
- What percentage of cost of goods sold depends on U.S. inputs?
- How much tariff cost did we actually pay or absorb in September?
- Could the business operate for twelve months if U.S. revenue fell 20%?
- Which capital projects improve both productivity and resilience?
- Which programs could improve those project economics without distorting the business case?
- Which non-U.S. market has the best realistic contribution margin, not merely the largest theoretical market?
- How much of family net worth depends on the operating company and related real estate?
- Is succession still viable at today’s maintainable EBITDA and financing conditions?
- What decision would we regret not making if current uncertainty lasts three years?
What we are watching for November
The October 28 Bank of Canada decision and Monetary Policy Report will be the first major official Canadian forecast update after the September escalation. Statistics Canada will release August trade data and September labour data during October, followed later by Q3 indicators. In the United States, the BEA advance Q3 GDP estimate is scheduled for October 29. These releases will begin to show whether September’s tariff escalation changed orders, employment, investment and inflation or whether the economy continued to adapt. [8][15]
We will also monitor whether the Productivity Mega Deduction advances through Parliament, whether the Section 338 product exclusions expand, whether Canada announces further countermeasures, how quickly RTRI and other liquidity programs deploy capital, and whether non-U.S. export gains broaden from commodities into manufactured goods and services.
The central planning message remains simple. Economic cycles change. Tariff schedules change. Tax rules change. Family ambitions usually endure. The goal is not to predict every government decision; it is to structure the enterprise and family balance sheet so that uncertainty does not force the family into a decision it would not otherwise make.
Tell us your ambitions, and we will guide you there.
Chart notes and evidence standards
The charts in this publication use official Canadian and U.S. government or central-bank data. Where U.S. quarterly GDP is shown beside Canadian quarterly GDP, the chart converts Canada’s quarter-over-quarter rate to an annualized equivalent for a like-for-like visual comparison and labels the transformation. METR figures are Department of Finance Canada estimates and should not be interpreted as statutory corporate tax rates. The valuation chart is explicitly illustrative and does not represent a forecast or appraisal of any actual business.
Official observations are cited to the release available at the information cut-off. Government statements about motives, discrimination or fairness in the trade dispute are attributed to the government making the statement rather than adopted as independent conclusions. Proposed legislation is described as proposed until enacted.
Important use limitation
This publication is educational and general in nature. It is not legal, tax, investment, customs or accounting advice for any particular person or business. Tariff classification, origin, remission, tax incentives, government funding, foreign expansion and succession planning all depend on specific facts and current law. Professional advice should be obtained before implementing a transaction or relying on a program.
Official source register
Government and central-bank sources only. Links are provided for verification and application details. Accessed or current through September 30, 2026 unless otherwise dated.
[1] Statistics Canada. Gross domestic product, income and expenditure, second quarter 2026. Official source [2] Statistics Canada. Gross domestic product by industry, July 2026. Official source [3] Statistics Canada. Labour Force Survey, August 2026. Official source [4] Statistics Canada. Consumer Price Index, August 2026. Official source [5] Statistics Canada. Labour productivity, hourly compensation and unit labour cost, second quarter 2026. Official source [6] Statistics Canada. Canadian international merchandise trade, July 2026. Official source [7] Statistics Canada. Canadian Survey on Business Conditions, third quarter 2026. Official source [8] Bank of Canada. Bank of Canada maintains policy rate at 2.25%, September 2, 2026. Official source [9] Bank of Canada. Adapting to structural forces, navigating uncertainty, September 21, 2026. Official source [10] Bank of Canada. Global trade is changing how the Canadian economy works, September 24, 2026. Official source [11] U.S. Bureau of Labor Statistics. The Employment Situation – August 2026. Official source [12] U.S. Bureau of Labor Statistics. Consumer Price Index – August 2026. Official source [13] U.S. Bureau of Labor Statistics. Productivity and Costs – Second Quarter 2026, Revised. Official source [14] Federal Reserve Board. FOMC statement, September 16, 2026. Official source [15] U.S. Bureau of Economic Analysis. GDP third estimate, Q2 2026; official release schedule and interactive data updated September 30, 2026. Official source [16] U.S. Census Bureau / BEA. U.S. International Trade in Goods and Services, July 2026. Official source [17] Department of Finance Canada. Complete list of U.S. products subject to counter-tariffs effective September 8, 2026. Official source [18] Department of Finance Canada. Process for requesting remission of tariffs on certain U.S. goods. Official source [19] White House. Proclamation excluding certain Canadian alcoholic beverages, effective September 29, 2026. Official source [20] White House. Proclamation excluding certain Canadian dairy-related products, effective September 29, 2026. Official source [21] White House. Proclamation excluding certain Canadian motor-vehicle-related products, effective September 29, 2026. Official source [22] Office of the U.S. Trade Representative. Statement on September 8 Section 338 actions concerning Canada. Official source [23] Global Affairs Canada. CUSMA Chapter 2 – National Treatment and Market Access for Goods. Official source [24] Global Affairs Canada. CUSMA Chapter 31 – Dispute Settlement. Official source [25] Global Affairs Canada. CUSMA Chapter 32 – Exceptions and General Provisions. Official source [26] Global Affairs Canada. CUSMA Chapter 34 – Final Provisions. Official source [27] Department of Finance Canada. Productivity Mega Deduction announcement and METR estimates, September 15, 2026. Official source [28] Department of Finance Canada. Draft legislative proposals for the Productivity Mega Deduction, September 15, 2026. Official source [29] Prime Minister of Canada. First Canada Investment Summit – investment and financing commitments, September 15, 2026. Official source [30] Canada Revenue Agency. Corporation tax rates. Official source [31] Government of Alberta. Corporate income tax rates. Official source [32] Prairies Economic Development Canada. Regional Tariff Response Initiative in the Prairie provinces – apply and eligibility. Official source [33] Pacific Economic Development Canada. Regional Tariff Response Initiative in British Columbia – apply and eligibility. Official source [34] Business Development Bank of Canada. Pivot to Grow expanded tariff liquidity stream. Official source [35] Export Development Canada. Trade Impact Program – expanded exporter support. Official source [36] Employment and Social Development Canada. Work-Sharing Program and tariff special measures. Official source [37] Employment and Social Development Canada. Worker Retention Grant. Official source [38] Government of Alberta. Alberta Export Expansion Program. Official source [39] Government of Alberta. Level Up export resource hub. Official source [40] Government of Alberta. Alberta Manufacturing Productivity Grant. Official source [41] Government of British Columbia. B.C. Employer Training Grant. Official source [42] Government of British Columbia. B.C. Manufacturing and Processing Investment Tax Credit. Official source [43] Government of Saskatchewan. Small and Medium Enterprise Investment Tax Credit. Official source [44] Government of Saskatchewan. Saskatchewan Commercial Innovation Incentive. Official source [45] Prairies Economic Development Canada. Business Scale-up and Productivity. Official source [46] Prairies Economic Development Canada. Regional Artificial Intelligence Initiative. Official source [47] Agriculture and Agri-Food Canada. AgriMarketing – Market Diversification for SMEs. Official source [48] Farm Credit Canada. Trade Disruption Customer Support Program. Official source [49] Trade Commissioner Service. CanExport SMEs – intake and program information. Official source [50] Canada Border Services Agency. Duties Relief Program. Official source [51] Department of Justice Canada. Income Tax Act, section 12 – income inclusions including government assistance. Official source [52] Department of Justice Canada. Income Tax Act, section 111 – losses. Official source [53] Department of Justice Canada. Income Tax Act, section 85 – transfers of eligible property. Official source [54] Department of Justice Canada. Income Tax Act, section 86 – share reorganizations. Official source [55] Department of Justice Canada. Income Tax Act, section 55 – intercorporate dividends. Official source [56] Department of Justice Canada. Income Tax Act, section 84.1 – non-arm’s-length share transfers. Official source [57] Department of Justice Canada. Income Tax Act, section 110.6 – capital gains deduction. Official source [58] Department of Justice Canada. Income Tax Act, section 70 – death and rollovers. Official source [59] Department of Justice Canada. Income Tax Act, section 247 – transfer pricing. Official source [60] Canada Revenue Agency. Information returns relating to foreign affiliates (T1134). Official sourceData note: The U.S. BEA third-estimate GDP release was scheduled and published on September 30, 2026; the Word source register links to BEA’s official release schedule because the release page had not yet propagated consistently through public indexing at the drafting cut-off. The BEA interactive tables are the controlling current data source.
Tell us your ambitions, and we will guide you there.
This information is for discussion purposes only and should not be considered professional advice. There is no guarantee or warrant of information on this site and it should be noted that rules and laws change regularly. You should consult a professional before considering implementing or taking any action based on information on this site. Call our team for a consultation before taking any action. ©2026 Shajani CPA.
Shajani CPA is a CPA Calgary, Edmonton and Red Deer firm and provides Accountant, Bookkeeping, Tax Advice and Tax Planning service.

Related Posts